What a beta of 4.34 really tells you about a commodity
High-amplification flows aren't riskier by default. Here's how to read sensitivity next to alpha before you act on it.
EMMay 2026
Orion turns global import & export data into benchmark sensitivity, volatility and tariff analytics — across 5,000+ HS commodity codes. The same lens a portfolio manager uses, pointed at physical trade.
Every commodity is scored against a benchmark and read for risk, return and asymmetry — so you can compare flows the way you'd compare assets.
Beta, alpha, correlation and tracking error for any flow against a total-trade benchmark. See which commodities amplify the cycle and which dampen it.
β · α · ρ · TEUpside and downside volatility, skewness, kurtosis and 5% VaR. Distinguish steady traders from positions carrying a heavy left tail.
σ⁺ · σ⁻ · VaR · skewLayer tariff regimes onto any commodity and partner. Model the delta on landed cost and trade-flow exposure before the policy lands.
Δ landed costDrill from a global HS section down to a single origin–destination corridor. Foreign origins, U.S. districts and transport modes, all in one tree.
origins · corridorsPre-built report types for sensitivity, performance, seasonality and volatility — saved selections recall a full filter context in one click.
saved selectionsEvery report reads itself back in plain language — what the beta, skew and tail mean for the position, written next to the numbers.
plain-language readChoose a commodity, direction and transport mode — or recall a saved selection. Filter from a global section down to a single corridor.
Orion scores the flow against its benchmark: beta, alpha, volatility, capture ratios and tail risk, computed nightly on fresh trade data.
Numbers come with a written read and asset-style tags — high-beta amplifier, tail-heavy, asymmetric upside — ready to share or export.
A single screen reads a commodity as a portfolio asset — benchmark relationship, risk-adjusted performance, cyclical capture and the full return distribution.
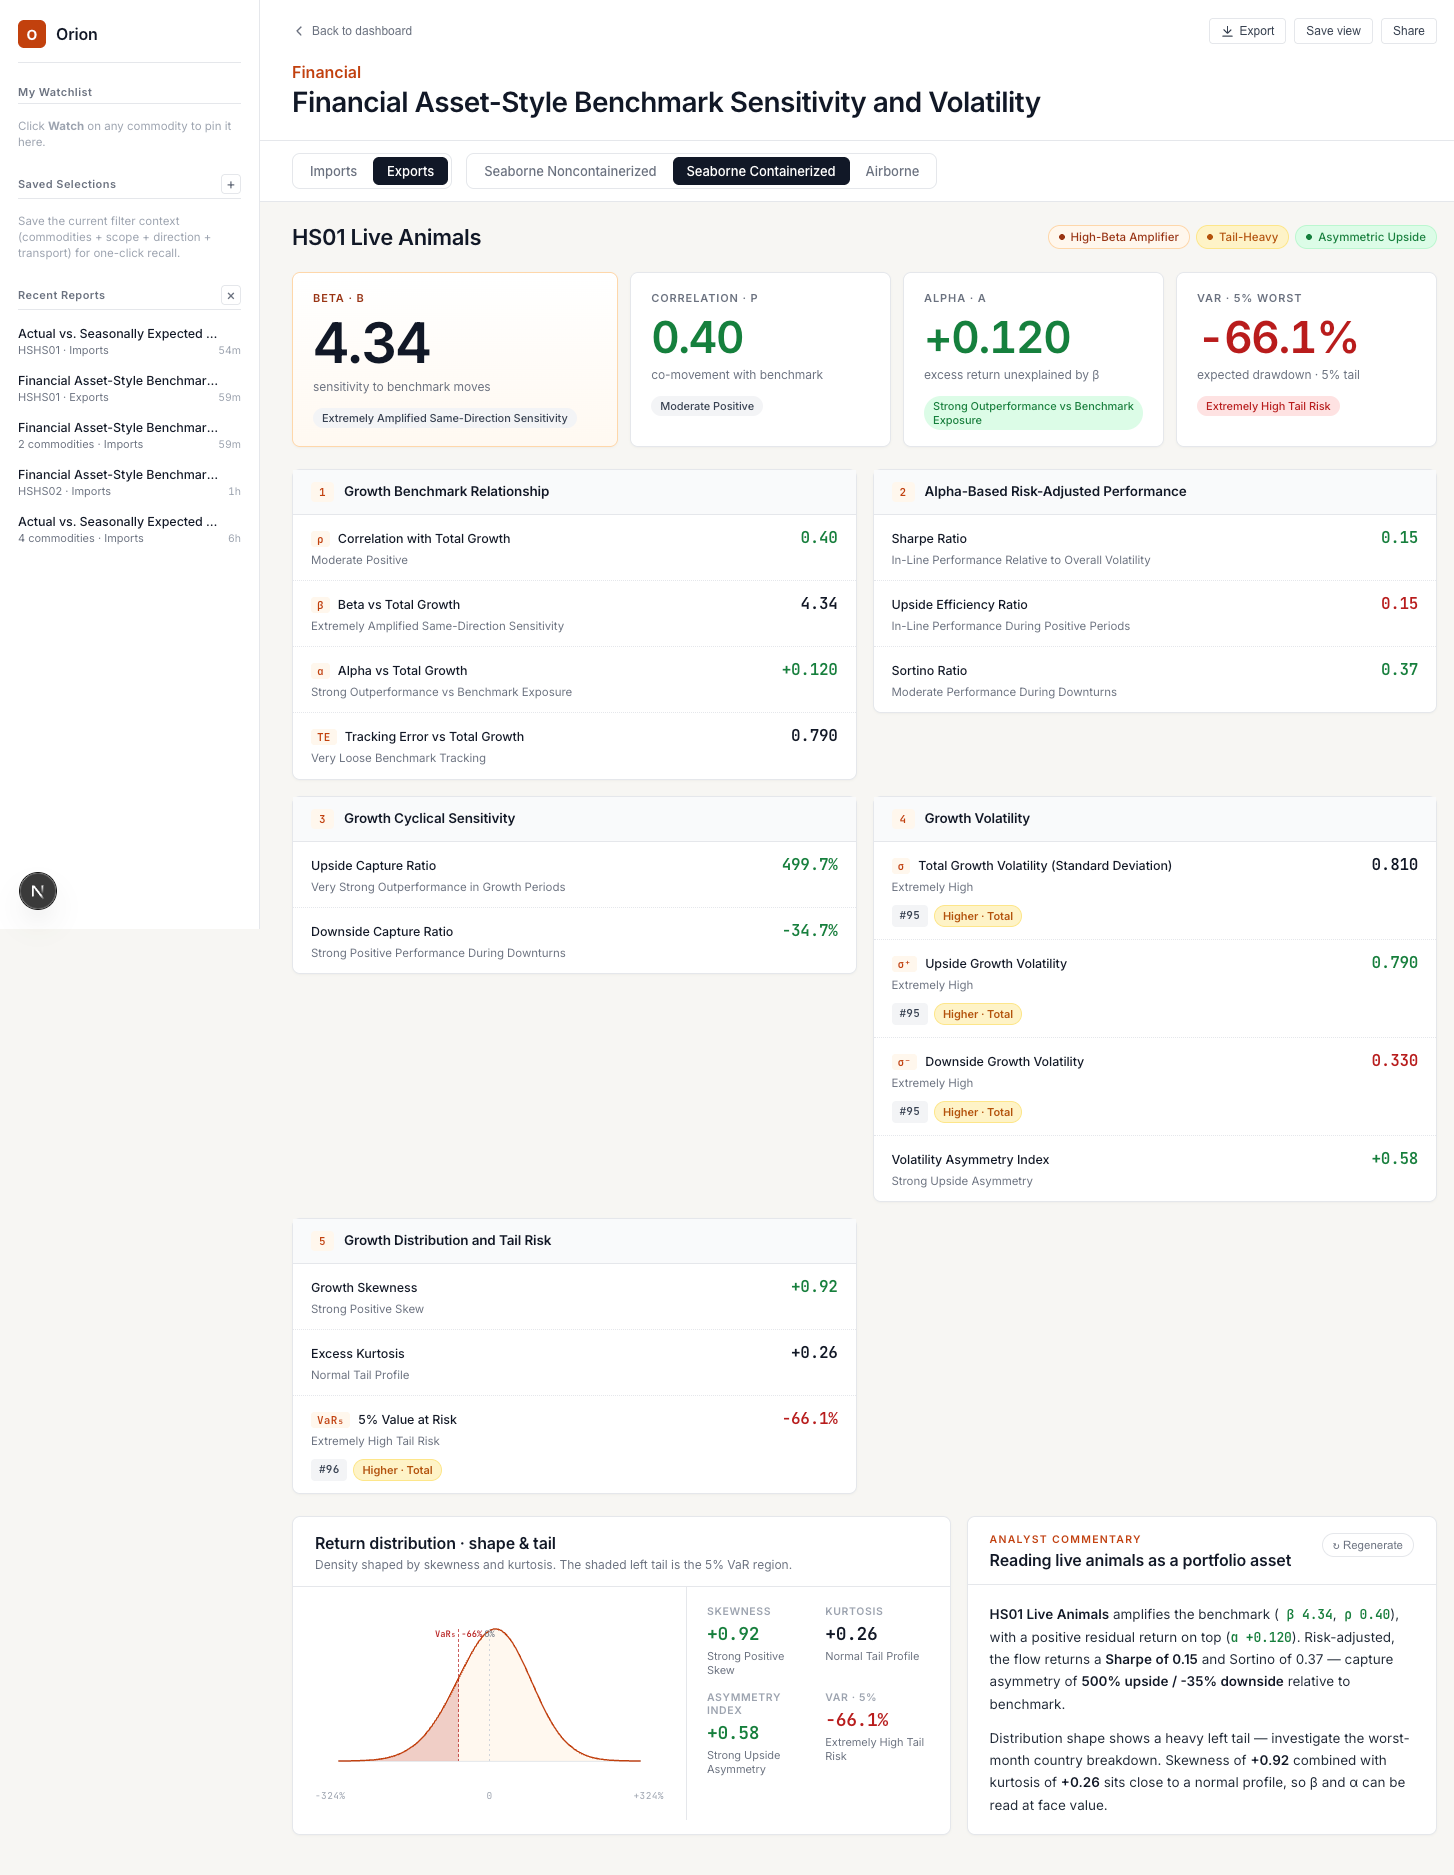
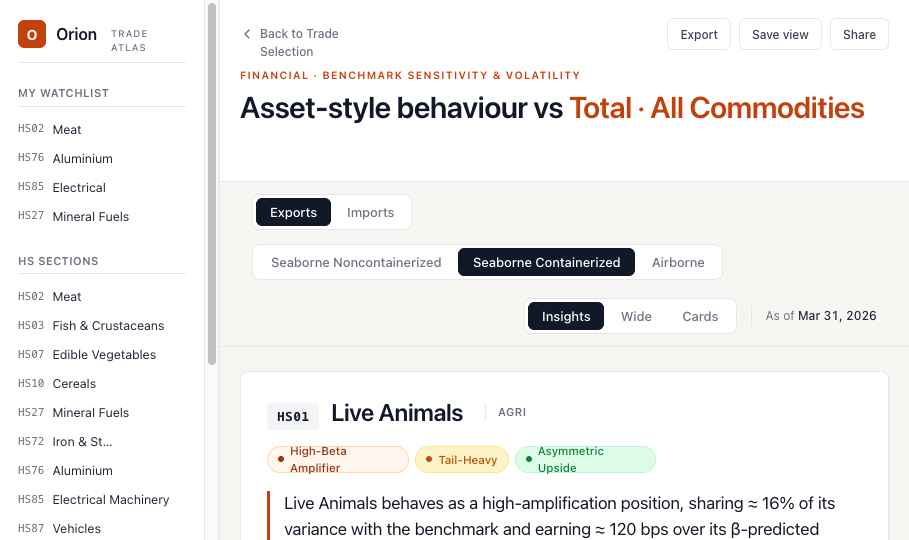
Direction, transport mode and benchmark stay pinned to the header, so a beta of 4.34 always reads against the right comparison — never a number floating without a frame.
High-amplification flows aren't riskier by default. Here's how to read sensitivity next to alpha before you act on it.
A practical walk-through of layering a tariff regime onto a corridor and reading the exposure delta.
A positive skew with a fat tail is a specific signal. We unpack what it means for downside capture.
Get a walkthrough on your own commodities and corridors. We'll build a sample report from your watchlist.